


Good news! You can now monitor your push notifications directly through your fluux.io console, offering better visibility into the status and delivery of messages to your users.
How to Access Push Logs
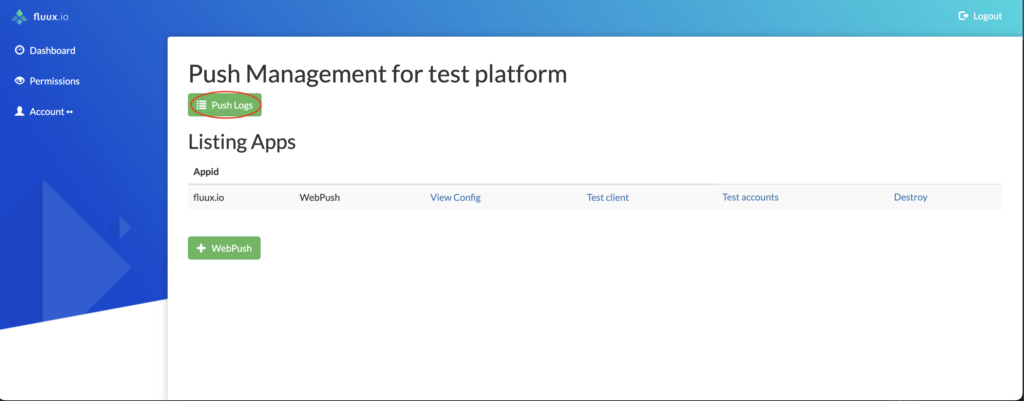
To start, navigate to the Push Apps list in your Fluux.io dashboard (see WebPush support for instructions). From there, you can access the Push Logs section, which provides detailed insights into the push notifications sent from your server.
Tracking Push Notification Status
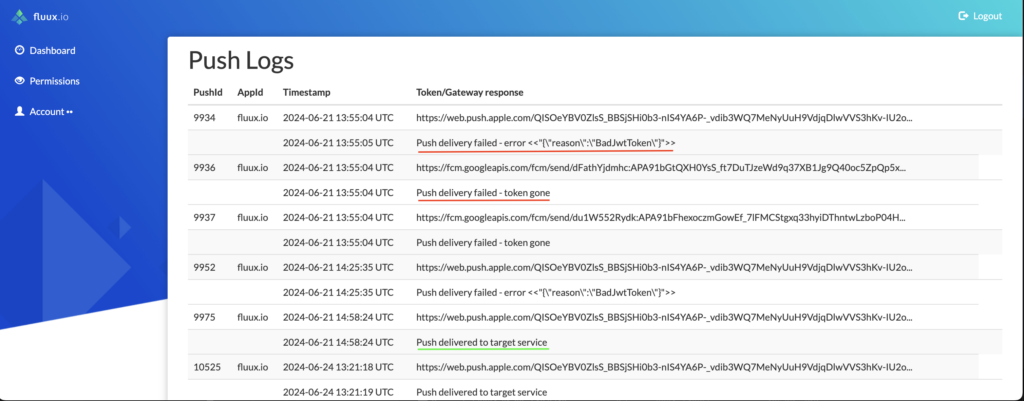
Once a push notification is triggered, you can check its status through the push gateway. This feature offers critical information about your users’ devices and the delivery process, enabling you to troubleshoot common issues more efficiently. For example, you may encounter:
- BadToken: This indicates that something went wrong during the device registration process, rendering the token invalid.
- Token Gone: This means the device’s registration has been canceled by the push provider, for example because the app has been uninstalled, the device replaced or the token rotated.
In both scenarios, your client application will need to re-register the user’s device to ensure successful notifications going forward.
Debugging Delivery to User Devices
In addition to error tracking, you’ll also be able to see when a push has been successfully delivered to the gateway. If you’re working with Apple’s push notifications, APNs sandbox entries will include an apns-uniq-id. This identifier allows you to further trace the delivery of messages to the user’s device via the Apple Cloud dashboard -— an handy tool for those deep-dive debugging sessions.